

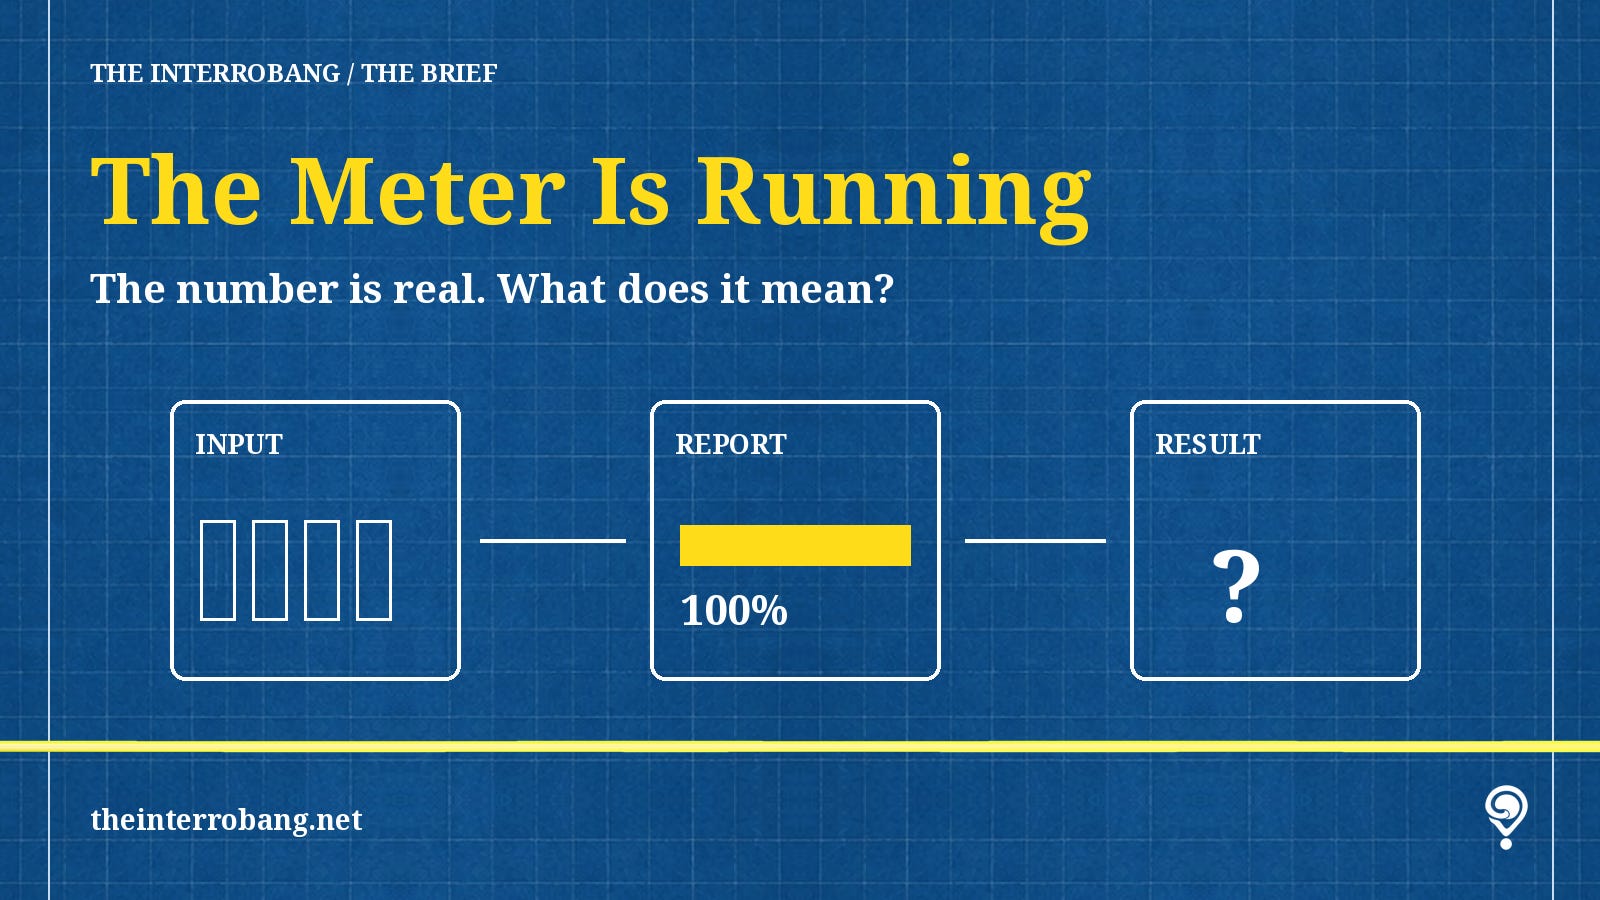
Burning more fuel is an odd way to prove the car is going somewhere.
Put the fuel bill on a leaderboard, though, and someone will win.
In May 2026, reports described Amazon employees using AI for unnecessary tasks to climb internal token-consumption rankings. Tokens are units an AI model processes. More tokens mean more activity and cost. They do not, by themselves, mean better work.
By May 29, 2026, Business Insider reported that Amazon had shut down KiroRank, an employee-made leaderboard. Amazon confirmed that it had been deprecated and described it as an informal tracker, not a formal or approved tool. That distinction matters. This was not an official performance-review system. It still gave people a number worth chasing.
The Financial Times first reported the shutdown. Coverage in HR Chief on June 4, 2026 quoted Amazon senior vice president Dave Treadwell telling staff: “Please don’t use AI just for the sake of using AI.”
A sensible instruction. Also an expensive thing to discover after installing a scoreboard.
The problem was not that employees failed to understand the measure. They understood it well enough to improve it. The measure was the part that needed supervision.
In my comic, FOOTNOTE ²: The Progress Bar, the goal is 112 percent. The system reports 100 percent. Communications inherits the explanation. Different plant, familiar management problem: a number has acquired more certainty than the thing it describes.
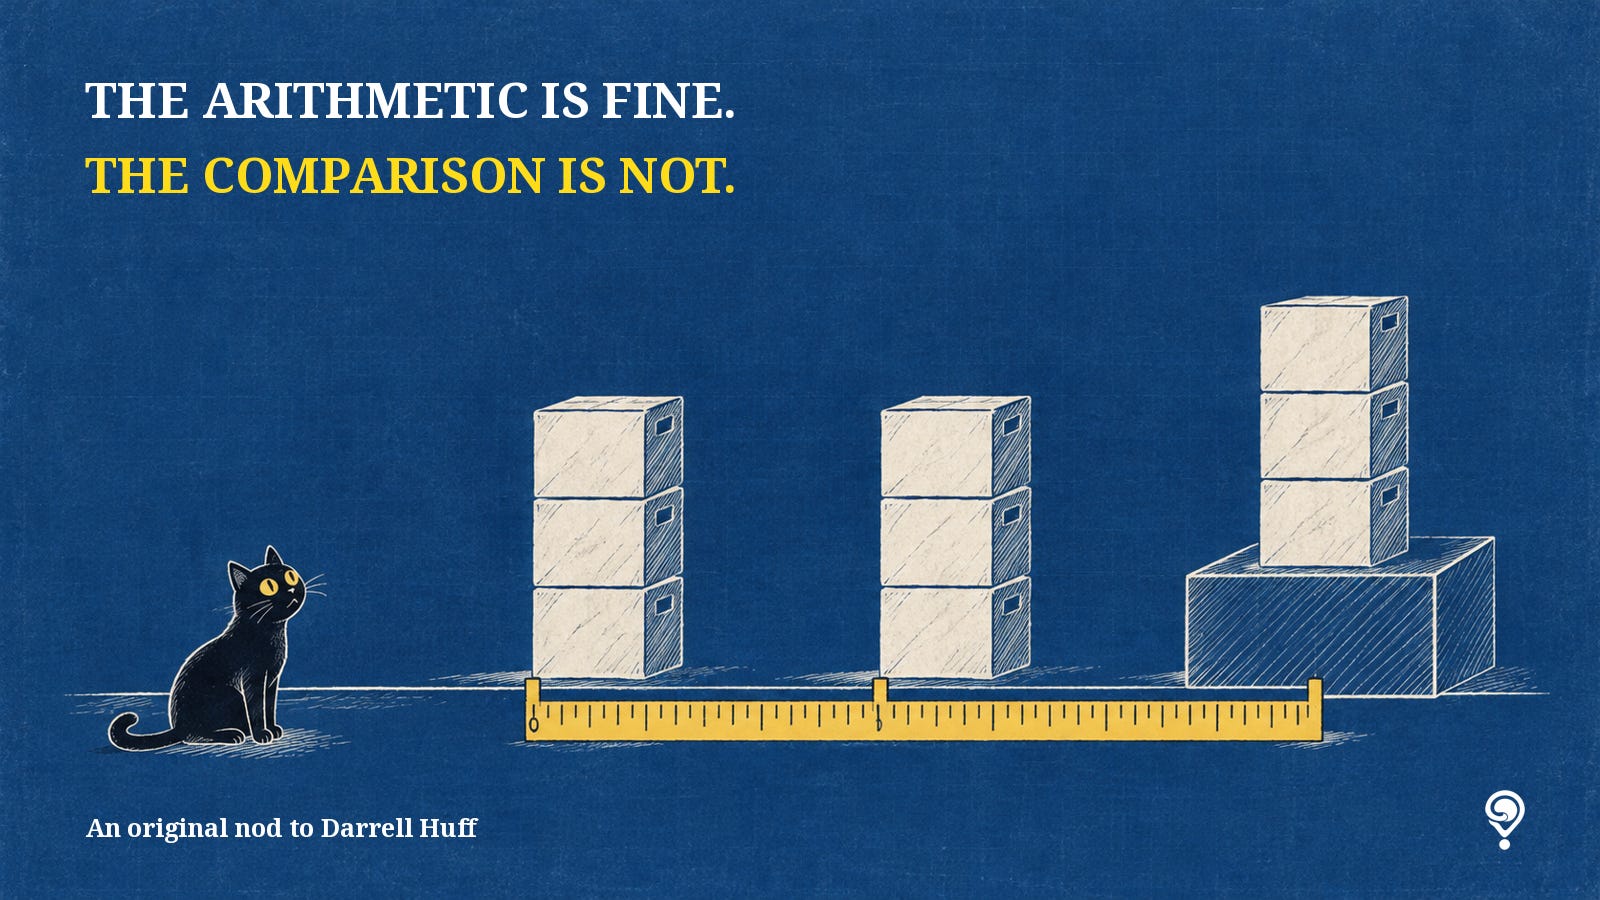
I read Darrell Huff’s How to Lie with Statistics as a kid. It accounts for about half the way I think, and it is still the best statistics book I have read. Huff made me suspicious of something more interesting than a false number: a true number being used to support a conclusion it has not earned. The arithmetic can be right. The choice of what to count, what to compare and what to leave out can still lead us somewhere else.
I have carried that suspicion through a lot of systems. Lytho, which I knew as inMotionNow, helps manage creative work: requests, deadlines, reviews, workloads. Clarity PPM helps a project management office organize projects, resources and budgets across a portfolio. Google’s reporting tools help us examine things such as how people find and use a website. Tableau helps turn data into charts and dashboards so we can see patterns. These are different jobs. Counting work, tracking a project, observing an audience and displaying the numbers are not interchangeable ways of proving value.
They can belong to the same chain of reasoning. We fund a project, make something, put it in front of people and examine what happened. The systems can help us see each part. But a creative team finishing more requests does not prove the project worked. A project delivered on time does not prove the audience benefited. More visits do not prove people found what they needed. Put all three on one attractive dashboard and the missing connections are still missing. The chart has assembled the evidence. It has not made the argument.
What is measurement without reasoning? The count could be accurate while the meaning assigned to it was wrong. Before I reward a rising number, I need to explain why that rise should mean better work. Then I need to look at the work and see whether the explanation holds. That is Huff’s question carried into the meeting: what does this number actually allow us to conclude?
Econometrics, economic statistics, was my main field of study before business operations and marketing. For me, it was always about the numbers. Knowing what I am looking at, and being able to explain it, is an art form. A calculation gives me a result. Explaining what that result means requires me to understand the question, the choices behind the calculation and the limits of the answer.
That is why psychohistory, one of my favorite terms from Isaac Asimov’s Foundation, belongs here. In the novel, it makes the future of a civilization something that can be predicted. Econometrics sometimes felt like that: find the patterns, understand the relationships, work out what comes next. But observing a pattern, explaining it and predicting the future are different claims. A dashboard can make the leap between them look smaller than it is. Huff keeps me looking at the assumptions. I can enjoy Asimov’s idea without mistaking this quarter’s report for Hari Seldon’s plan.
Market studies bring the same problem closer to home. I want to understand my market, so I choose whom to ask, which questions to ask and what will count as an answer. Those choices shape the result before the first percentage appears. An average can hide differences I need to see. A comparison can join groups that do not belong together. If I return to my original hunch after the study, I should say so, rather than make the percentage take responsibility for my judgment. Huff does not make research pointless. He makes the choices behind it part of the evidence.
That is a corporate decision before it is a reporting problem. Most people want to know the number they need to hit. Give them a target and they will work toward it. The why is noise until management understands it well enough to explain it. If I cannot say what materially changes when we hit the number, I am asking people to chase a target on faith. Calling it a strategic priority does not improve the explanation.
But a why that holds up is gold. If hitting the number means customers spend less time waiting, fewer mistakes reach them or the team can finish useful work without another round of corrections, say that. Explain the connection and show the evidence. That can put a fire under people because the target has a purpose they can understand. Until then, it is corporate jargon with a number attached. The problem is not that people want to hit the number. It is that management has not made the number worth hitting.
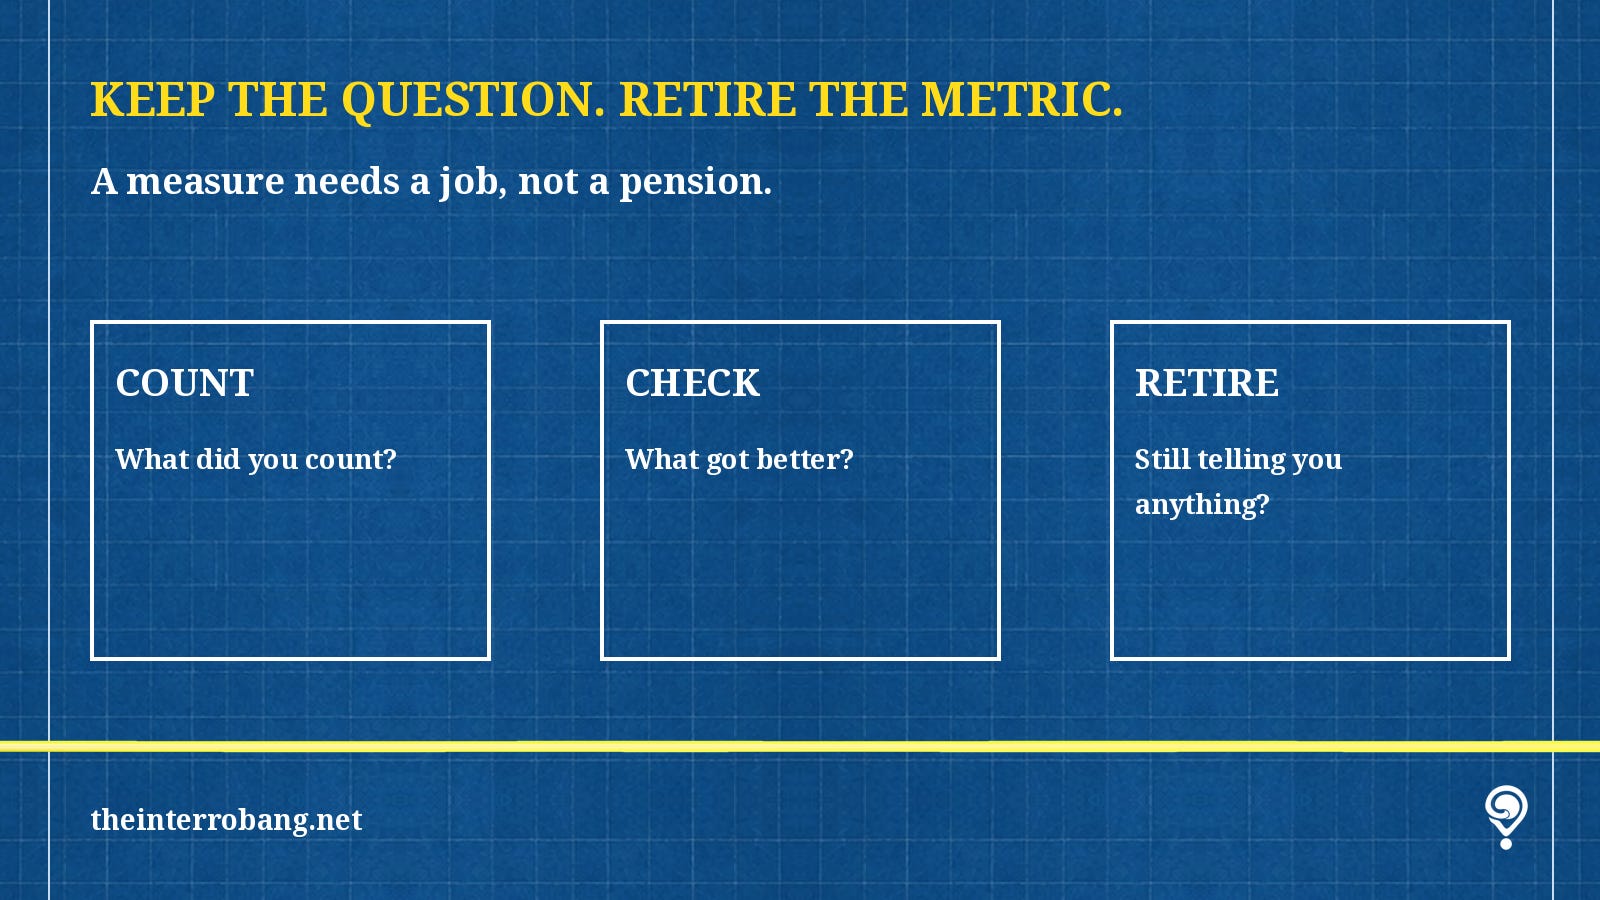
Then decide when the measure has finished its job. Usage can tell us whether people are trying a new tool. That is useful during a rollout. Later, we need to know whether a customer got a better answer, a defect disappeared or useful work finished sooner. If we keep rewarding adoption after adoption is no longer the question, we are feeding an old measure because it is already on the dashboard. Retiring it feels like losing information. Sometimes it is admitting that the information no longer answers the question.
The Progress Bar puts that problem in a fictional plant. June, who runs Corporate Communications, has been assigned to explain a goal management has not explained to her. Selden, a new worker, keeps asking what the work is for. The goal is 112 percent; the system reports 100 and calls it achieved. June has a message to deliver. Selden still wants to know what changed. That is the gap Huff taught me to inspect: the count is finished, but the conclusion is not. The system can tell us what it counted. Management still has to explain how that count connects to the result it promised. Until it can, the dashboard has reported a number, not proved success.
Before the next dashboard review, pick one measure and finish this sentence:
“When this number improves, ______ gets better for ______.”
Name the result and the person who benefits. “More activity” does not count. Neither does “the dashboard turns green.”
Then look at one recent piece of work. Was the result better? Include the time spent checking and correcting it, not just the time saved producing the first version. Keep usage as a diagnostic if it helps. Do not ask it to impersonate an outcome.
If the number rose and the work did not improve, that is not an employee-attitude problem. It is a reason to inspect the measure before awarding another badge.
At your next meeting, which rising number will you ask to show its work‽
THIS WEEK AT THE INTERROBANG - Week 2: The Hundred Percent
One truth: the goal was 112 percent, the system said 100. Three angles on it:
You are reading: The Brief ‽
Sources
- Financial Times, May 12, 2026: “Amazon staff use AI tool for unnecessary tasks to inflate usage scores.” Original reporting; subscription required. The Decoder summary below provides accessible coverage.
https://www.ft.com/content/8ee0d3ef-9548-422d-8ff1-ebd48ad4b2ca?syn-25a6b1a6=1
- Maximilian Schreiner, The Decoder, May 12, 2026: “Tokenmaxxing” spreads at Amazon as employees game internal AI leaderboards. Reporting attributed to the Financial Times.
https://the-decoder.com/tokenmaxxing-spreads-at-amazon-as-employees-game-internal-ai-leaderboards/
- Brent D. Griffiths, Business Insider, May 29, 2026: Amazon says it shut down a token leaderboard: “Don’t use AI just to use AI.” Includes Amazon’s confirmation and informal-tool qualification.
https://www.businessinsider.com/amazon-ai-leaderboard-tokenmaxxing-2026-5
- Isaiah McCall, HR Chief, June 4, 2026: Amazon Axes AI Leaderboard After ‘Tokenmaxxing’ Backfires. Includes Treadwell quotation and Amazon statement, attributed to the Financial Times.